Every check looked the same, and every new test erased the last one
The original tool ran five checks for one URL and stacked them as identical green rows. Each row held raw command output with no reading of what it meant, and testing another domain replaced the results a technician might still need.
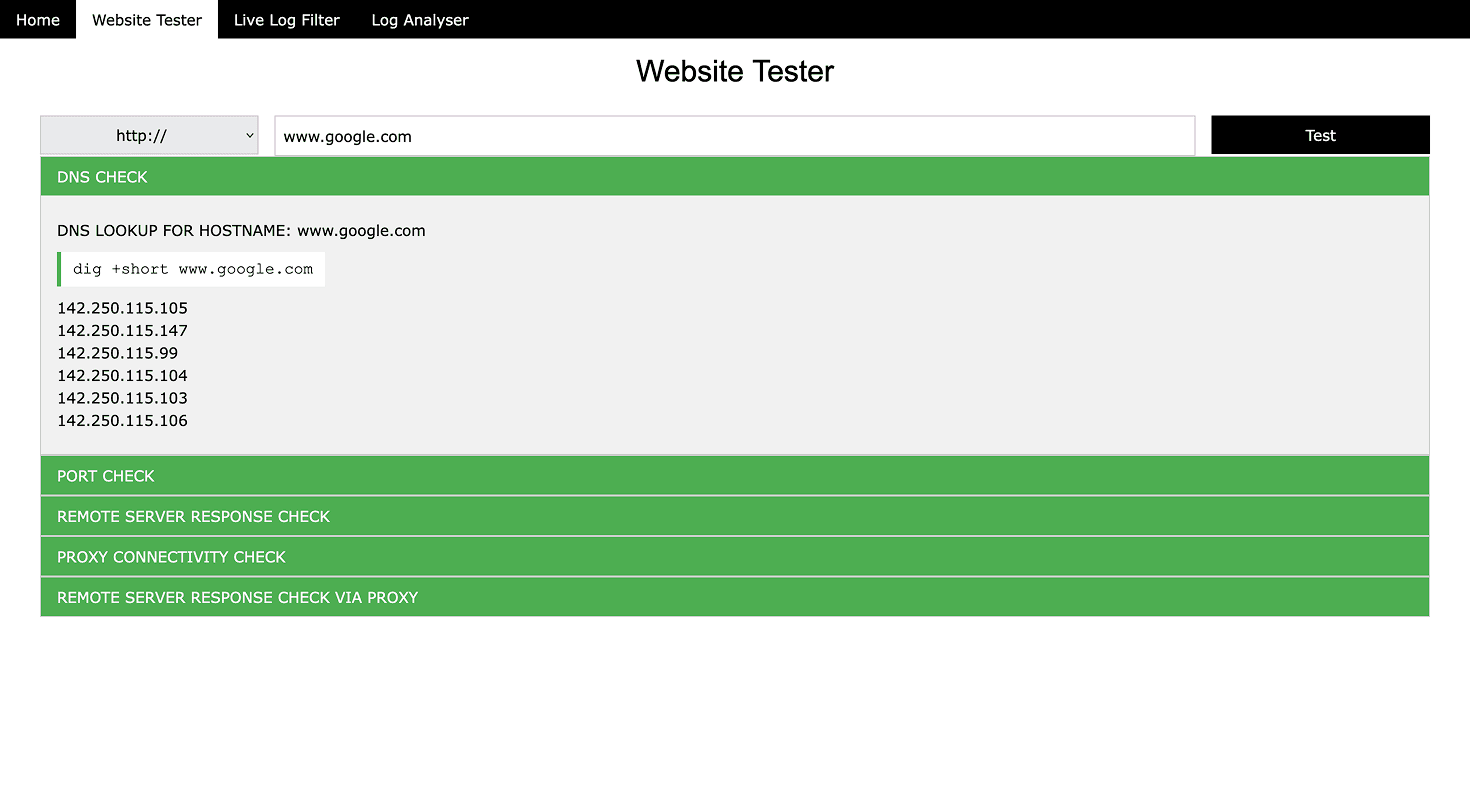
Troubleshooting is an investigation, not a one-off query.
When the technician reconstructed a recent investigation with me, the first result changed the next question. A DNS check could lead to the server, a port or the proxy, and earlier results still mattered.
A status alone was not enough. The values had to stay visible.
The technician needed the command and the raw values to trust a result, then returned to earlier results to compare. An explanation helps only when it sits beside that evidence.
The person investigating, and the person who acts on it
A diagnosis starts with a technician and usually ends with an engineer. The tool has to serve both ends of that handoff.
Network technician
Investigates connection failures
The first result changes my next question.
Needs
- Earlier tests still open while following the next clue
- The command and raw values behind every verdict
- Linux and Windows syntax without relearning the tool
Lives in
Support engineer
Receives the evidence and fixes the issue
Send me exactly what ran and what came back.
Needs
- The exact command and platform
- Values they can paste into a ticket
- A result they can rerun themselves
Lives in
Walking through a real investigation
I sat with a network technician who reconstructed a recent investigation step by step. Six behavioural questions, grouped into three themes, shaped everything that followed.
Investigation sequence
We asked
- What happened the last time a domain failed?
- Which check came first, and what happened next?
What I heard
The first result changed the next question. A DNS check could lead to the server, a port or the proxy.
Need: Keep earlier checks available as the investigation branches.
Reading and comparison
We asked
- How do you recognise a suspicious result?
- When do you return to an earlier domain?
What I heard
A status alone wasn’t enough. The technician needed the command and raw values, then went back to earlier results to compare.
Need: Put the explanation beside its evidence, and keep results easy to reopen.
Handoff and platform
We asked
- What happens after you understand a result?
- What changes between Linux and Windows?
What I heard
Understanding a result was only the handoff. It still had to be copied, shared or run again, sometimes in the other platform’s syntax.
Need: Attach follow-up actions to each report and keep both platforms familiar.
The same investigation, walked through both tools
I mapped the investigation the technician reconstructed, step by step, on the old tool, marked where it broke, then redesigned it around the next question rather than the last answer.
From one disposable result to an investigation that keeps its evidence
- Enter a URL
- Read five green rowsEvery check looks the same
- Decode the raw outputNo reading of what it means
- Test the next domainThe last result is replaced
- Re-type to compareEarlier evidence is gone
- Set domain, command and modeLinux or Windows, in the input
- RunThe test opens as its own tab
- Read grouped evidenceValues first, then one sentence
- Copy, download or rerunBeside every report
- Open the next domainEarlier tabs stay put
- Reopen an earlier tabSummary shows command and status
- Why it broke
- The tool treated troubleshooting as a single query. But the first result changes the next question, so wiping it the moment another domain was tested destroyed exactly the evidence the technician needed next.
- 6 behavioural questions, across three themes, shaped this flow
- What I designed
- One input for domain, command and Linux / Windows mode, confirmed before Run
- Each test opens as a named tab, so a new domain never replaces the last
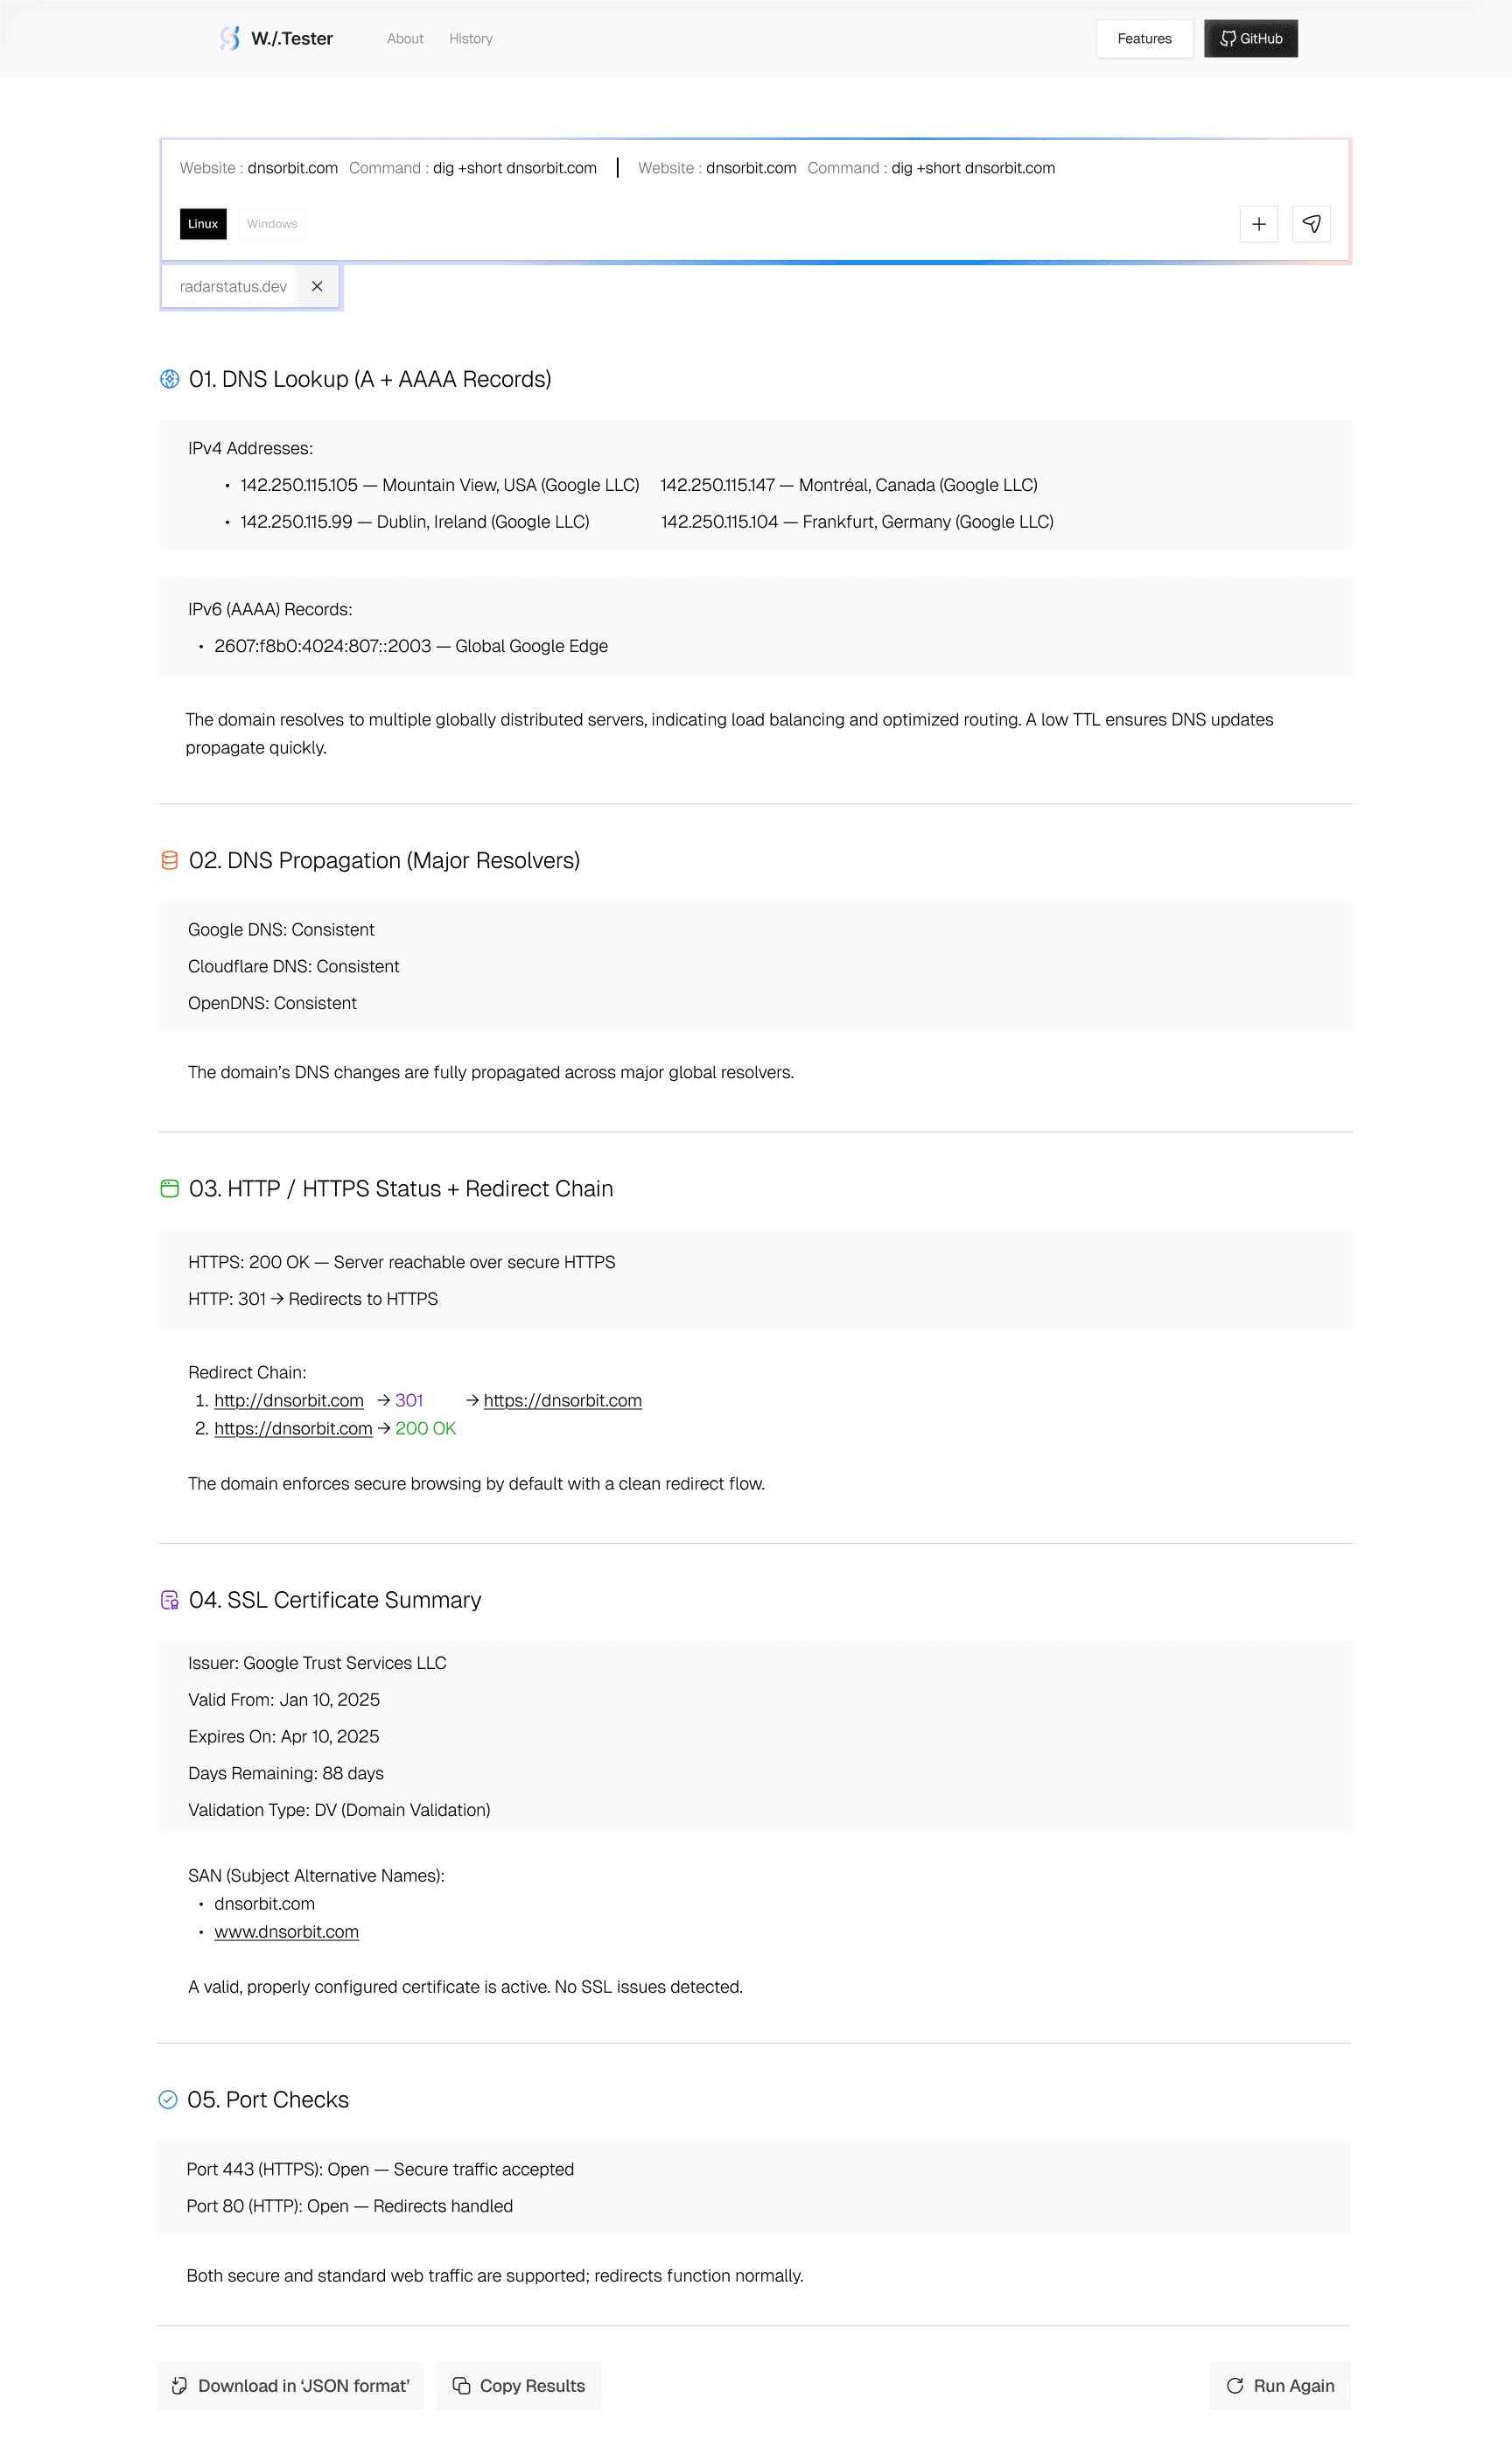
- Results grouped by the question they answer: DNS lookup, propagation, redirects, SSL and ports
- Raw values first, then a one-line plain-language reading
- Copy, Download JSON and Run Again at the end of every report
- Impact
- Nothing lost
- Earlier tests stay open and reopen without a rerun, confirmed with the technician in the prototype review
The redesigned flow in full
How a technician moves from entering a domain to reading grouped results, sharing them and returning to an earlier test.
Shaping the workspace: Two core layout decisions
Before moving to high fidelity, I compared low-fidelity layouts against how the technician described a real investigation: earlier results need to stay within reach, and a readable verdict must not hide the values behind it.
How should technicians structure long troubleshooting sessions?
In the investigation the technician reconstructed, one result led to the next check and sometimes to another domain. Browser-style tabs keep earlier tests open, so the technician can return to them without rerunning anything.
What depth of diagnostic evidence should the interface expose?
The technician wanted to know quickly what a result meant, but would only trust it after seeing the command and the values behind it.
One input, one tab per test, and results grouped by the question they answer
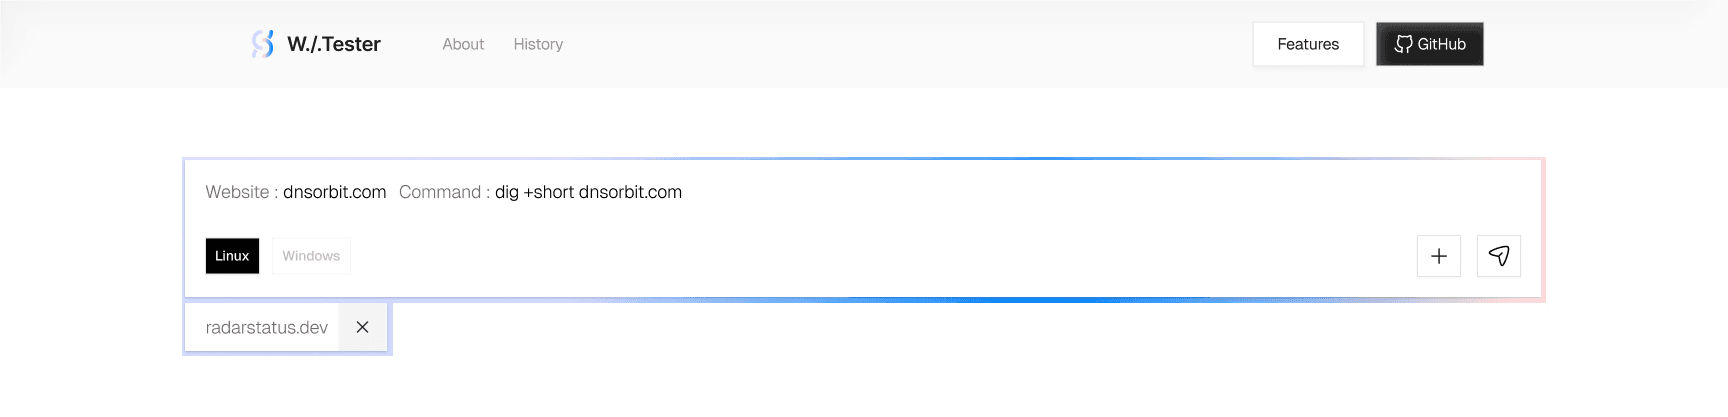
The prototype keeps the domain, command and platform together in one input. Each test opens as a tab, and its report groups DNS, HTTP, SSL and port results with a short plain-language reading.
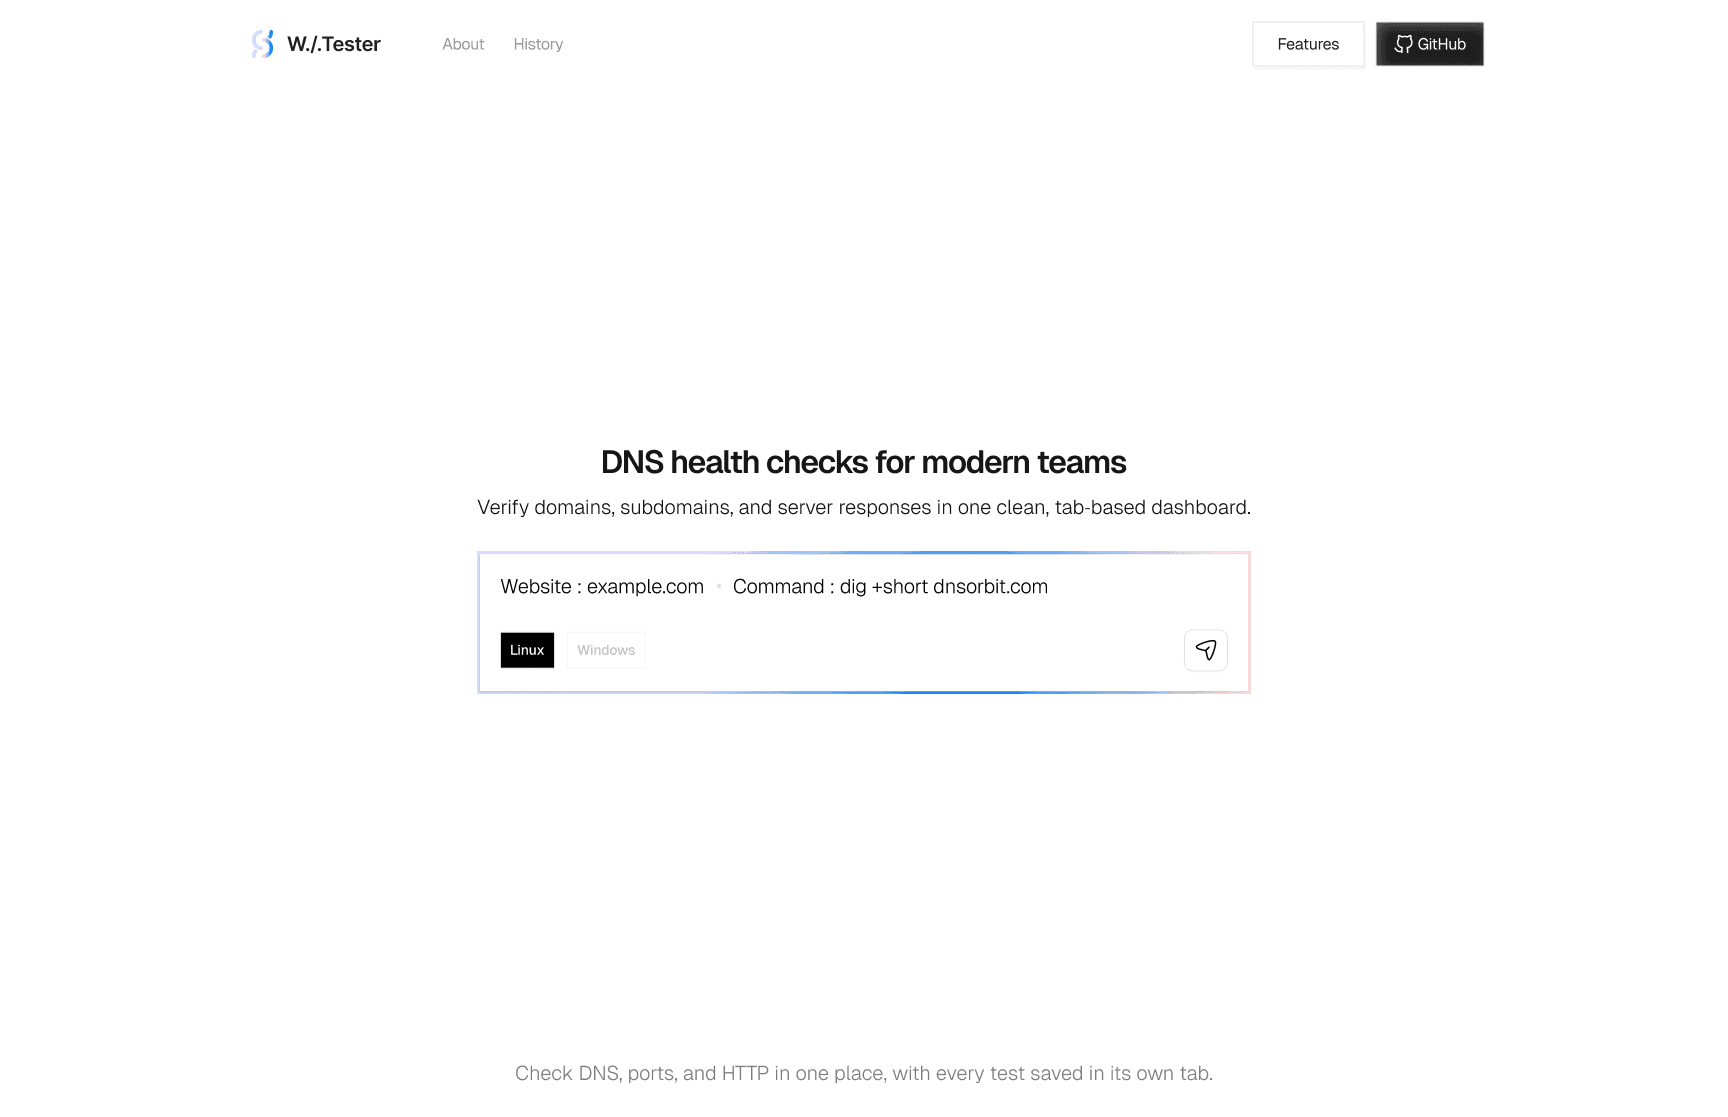
Desktop Application Information Architecture
A four-step model: enter a domain and command, keep each test as a tab, run the checks, then copy or download the evidence.
Raw values paired with a short, readable explanation
Each group shows the values first, such as resolved addresses, the redirect chain and certificate dates, then one sentence on what they mean. Copy, Download JSON and Run Again stay at the end of the report.
Domain, Command and Platform Together
The technician can confirm what will run, and in which command mode, before pressing Run.
Each Test Becomes a Tab
A completed test stays open as a named tab, so a new domain no longer replaces the last result.
Recall a Test Without Rerunning It
Expanding a tab shows the command it ran and a summary of its results, such as HTTP status and port checks, before reopening the full report.
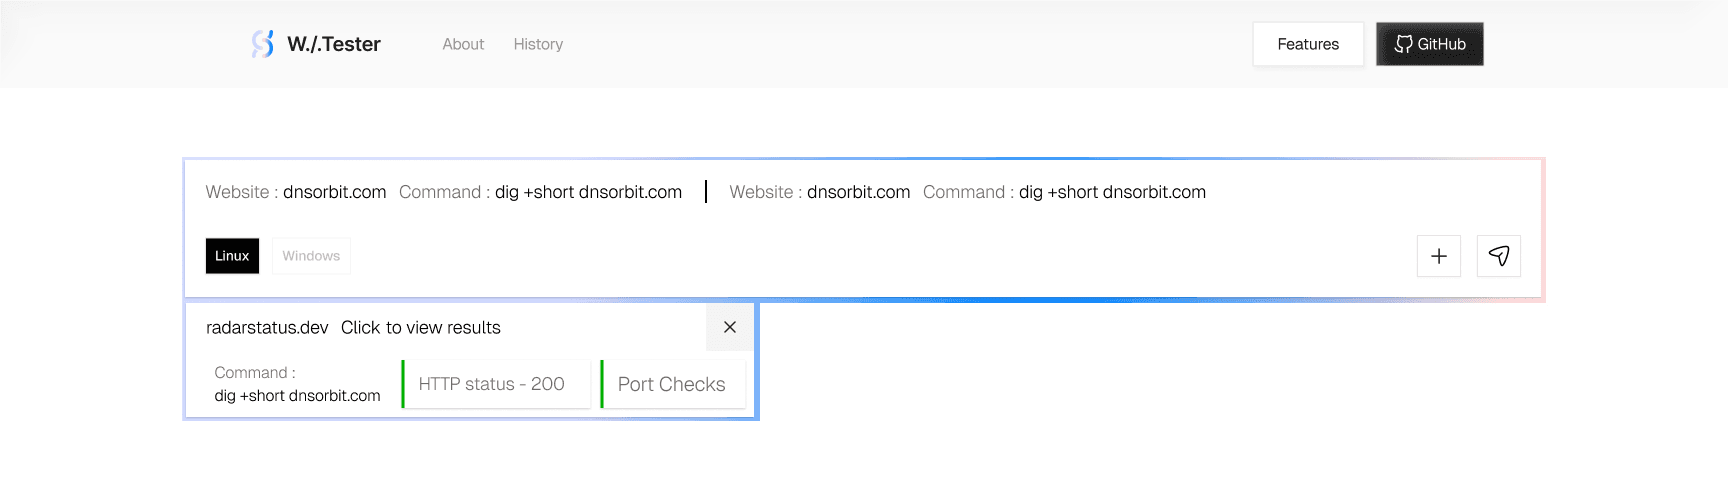
Linux or Windows Command Mode
Switching the mode changes the command syntax, for example dig to nslookup, while the layout and workflow stay the same.
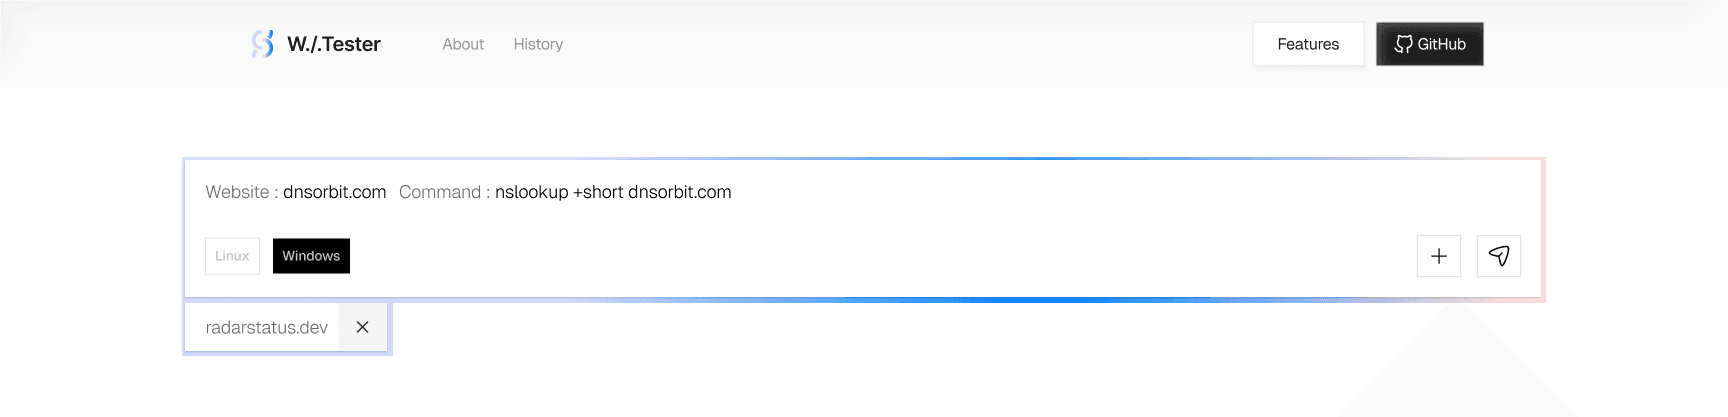
Four smaller calls that made the workspace trustworthy
The wireframes settled the structure. These decisions settled the details a technician touches on every test: what a report leads with, what a tab remembers, where the command mode lives and how evidence leaves the tool.
- Decision 01
Group results by the question they answer
- The question
- In what order should a report show five different checks?
- Options I weighed
- Why this one
- A technician reads a report to eliminate causes: is it DNS, the certificate, the port? Grouping by question lets them jump to the suspect and skip what’s already clear.
- Trade-off I accepted
- The report no longer mirrors the order the commands ran in, so each group keeps its own values in view.
- Decision 02
A tab remembers the test, not just the domain
- The question
- What does a technician need to see to pick an earlier test back up?
- Options I weighed
- Why this one
- Resuming means remembering what was tried. The expanded tab answers “what did I run, and what came back?” before the full report is opened.
- Trade-off I accepted
- Tabs carry more content, so they stay collapsed until expanded.
- How I knew
- Review 1: resuming a completed domain without rerunning it shaped the expanded summary.
- Decision 03
The command mode lives in the input
- The question
- Where should the Linux / Windows switch sit?
- Options I weighed
- Why this one
- The mode changes what actually runs, dig or nslookup. A choice that changes the command belongs where the command is reviewed, right before Run.
- Trade-off I accepted
- The input carries one more control, so the layout and workflow stay identical in both modes.
- How I knew
- Review 2: switching to Windows syntax moved the switch into the input.
- Decision 04
Follow-up actions sit on every report
- The question
- How does a result travel from the technician to the engineer who fixes it?
- Options I weighed
- Why this one
- Understanding a result is only half the job; the support engineer needs the exact command and values. Attaching the actions to the report keeps the evidence and its handoff together.
- Trade-off I accepted
- The same three actions repeat on every report, a small cost for never exporting the wrong test.
- How I knew
- Review 3: carrying a result forward put all three actions on every report.
Three moments, tested with the technician
I reviewed the interactive prototype with the technician around the three moments that broke the old tool. Each one changed the design.
Review 1 · Resume a completed domain
Reopen an earlier test without rerunning it. This shaped the expanded tab summary.
Review 2 · Switch command mode
Run the same check in Windows syntax. This moved the Linux / Windows switch into the input itself.
Review 3 · Carry a result forward
Share what came back with an engineer. This put Copy, Download JSON and Run Again on every report.
A desktop prototype built around the investigation
The deliverable was a desktop redesign and an interactive prototype, reviewed with a network technician. Here’s what it covers.
Key Learnings
Design the investigation, not just the result
The technician rarely ran one check and stopped. The first result changed the next question, so tabs had to preserve earlier tests instead of replacing them.
Simplifying a technical tool means explaining, not hiding
A plain-language reading only helped when the values behind it stayed visible and could be copied or downloaded.
Design for the long investigation next
The next round covers many open tabs, interrupted and failed checks, and whether the original tool’s proxy checks belong in the new report.
VxSure Launch Film
A 60-second launch film, directed by me and built in code.